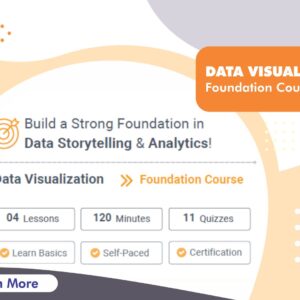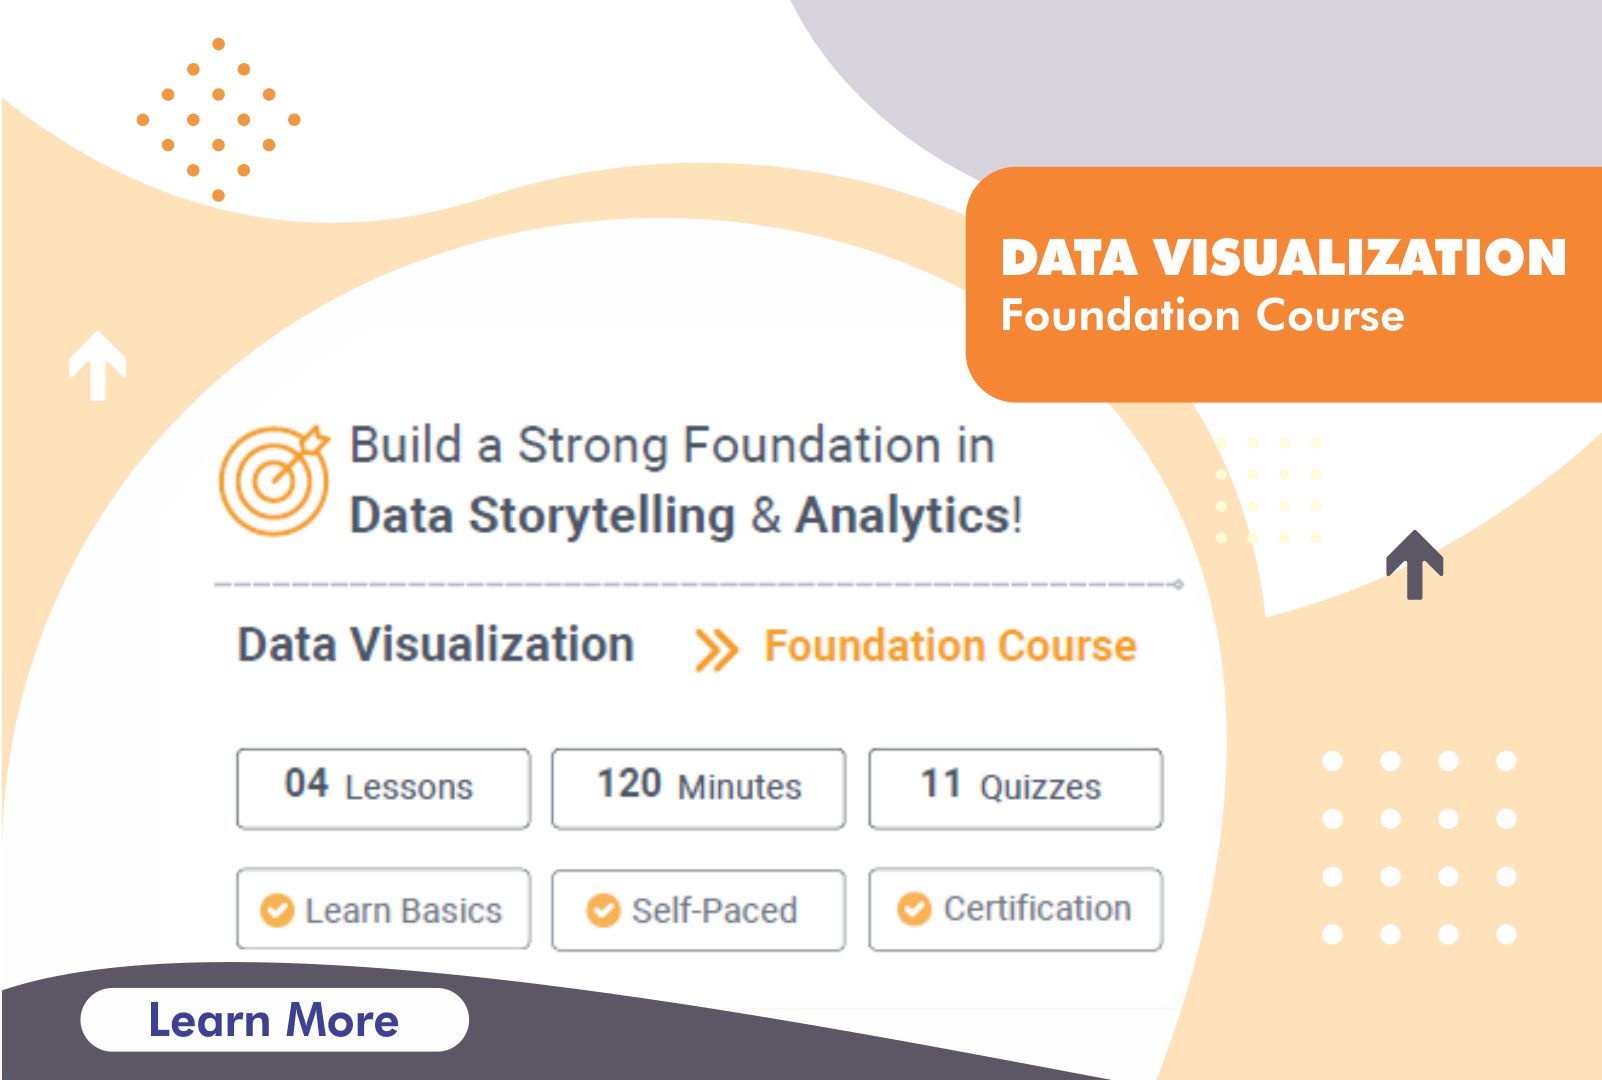
About the Course
In today’s data-driven world, visuals speak louder than numbers. The Data Visualization Foundation Course at Rubiversity is your gateway to understanding how data can be transformed into meaningful stories. Learn to create intuitive dashboards using RubiSight, structure your data for clarity, and use widgets, colors, and charts to communicate insights effectively. This course blends theory with practice through real-world scenarios, giving you the confidence to make data talk—visually and impactful. Ideal for beginners, this course focuses on analytical thinking and creative presentation, helping you deliver compelling data narratives that influence decisions.
Designed For
Beginners exploring data visualization
Students and freshers aiming to build career-ready analytics skills
Business professionals seeking to learn data-driven storytelling
Course Contents
INTRODUCTION TO DATA
01 | What is Data and its Importance?
02 | Forms and Types of Data
03 | Types of Data Sources
04 | Characteristics of Data
INTRODUCTION TO VISUAL ANALYTICS
01 | Fundamentals of Data Visualization
02 | Purpose of Visual Analytics
03 | Process of Visual Analytics
04 | Applications of Data Visualization
LET’S START DASHBOARDING!
01 | What is Dashboard?
02 | Classification of Dashboards
03 | Difference between Visualization and Dashboard
THE WORLD OF RUBISIGHT!
01 | Connecting Data to RubiSight
02 | Connecting Data to RubiSight – Hands-on
03 | Data Pane
04 | Data Pane – Hands-on
05 | Data Widgets and Its Formatting
06 | Data Widgets and Its Formatting – Hands-on
07 | Dashboard Enhancement
08 | Dashboard Enhancement – Hands-on
Duration
120 Hours
Validity of Login Id
The login Id ones purchased will be valid for 6 Months from the date of purchase. “Login Id” in the context of this learning subscriptions typically refers to a unique identifier assigned to a user for accessing the learning platform.
Certified By